Using machine learning to find patterns in Mexico's "forensic crisis"
We run 30,000 records of unidentified bodies through a natural language processor
The media NGO Quinto Elemento recently released a database of all the unidentified bodies registered by Mexico's state forensic services between 2006 and 2019. It contains 38,891 entries, with the place of discovery, the year it was discovered, the cause of death and other information. The database has been a key tool in the massive search for missing loved ones by various groups of aggrieved families across Mexico. It was also the center of a media scandal over the lackadaisical way Mexican authorities treat unidentified bodies, losing bodies, returning the wrong bodies to families, and discarding them in mass graves.
But what patterns could be found in this trove of data? As far as we could see nobody had waded into the numbers to pick trends that might say something about the wave of violence sweeping the country.
As useful as it is, the Quinto Elemento website was not made to allow complex querying of the data. Moreover, the data is in an execrable state, an indication of the utter lack of care on the part of authorities for tackling the problem of so many missing people. To deal with these problems we created an instance of Datasette, a Python program that enables rapid, customizable searching of large databases, as well as visualization of the data. We also applied simple machine learning algorithms to overcome the worst of the data inconsistencies. In another post we'll provide a brief tutorial in these techniques for anyone who wishes to do the same. Here, we'll review the few interesting observations they allowed us to tease out.
Incomplete data
The data is is such poor shape that it is difficult to believe it was created by professional forensic services. Each entry in the database lacks at least one piece of data, and many have no data at all. Almost 18% of the entries have no date of discovery, 27% don't indicate the sex of the deceased, 55% omit the place of discovery, 54% don't even show the cause of death, which you would think would be the principal product of a forensic investigation.

Among the data that does exist, there are many inconsistencies, especially concerning the cause of death. Some of the causes are veritable narratives...

Others say simply "traffic accident" or "decapitation", as if an impatient examiner had a lunch date to keep. Some entries describe the medical cause of death, for example "thoracic trauma," others simply the human implement that caused it, whether "knife", "bullet" or "train".
Wave of violence
Taking the data in this state, we can see that the number of cases of unidentified bodies is increasing every year.

But this is strange, because violence has not risen in the same way. In fact, it declined somewhat between 2011 and 2015.
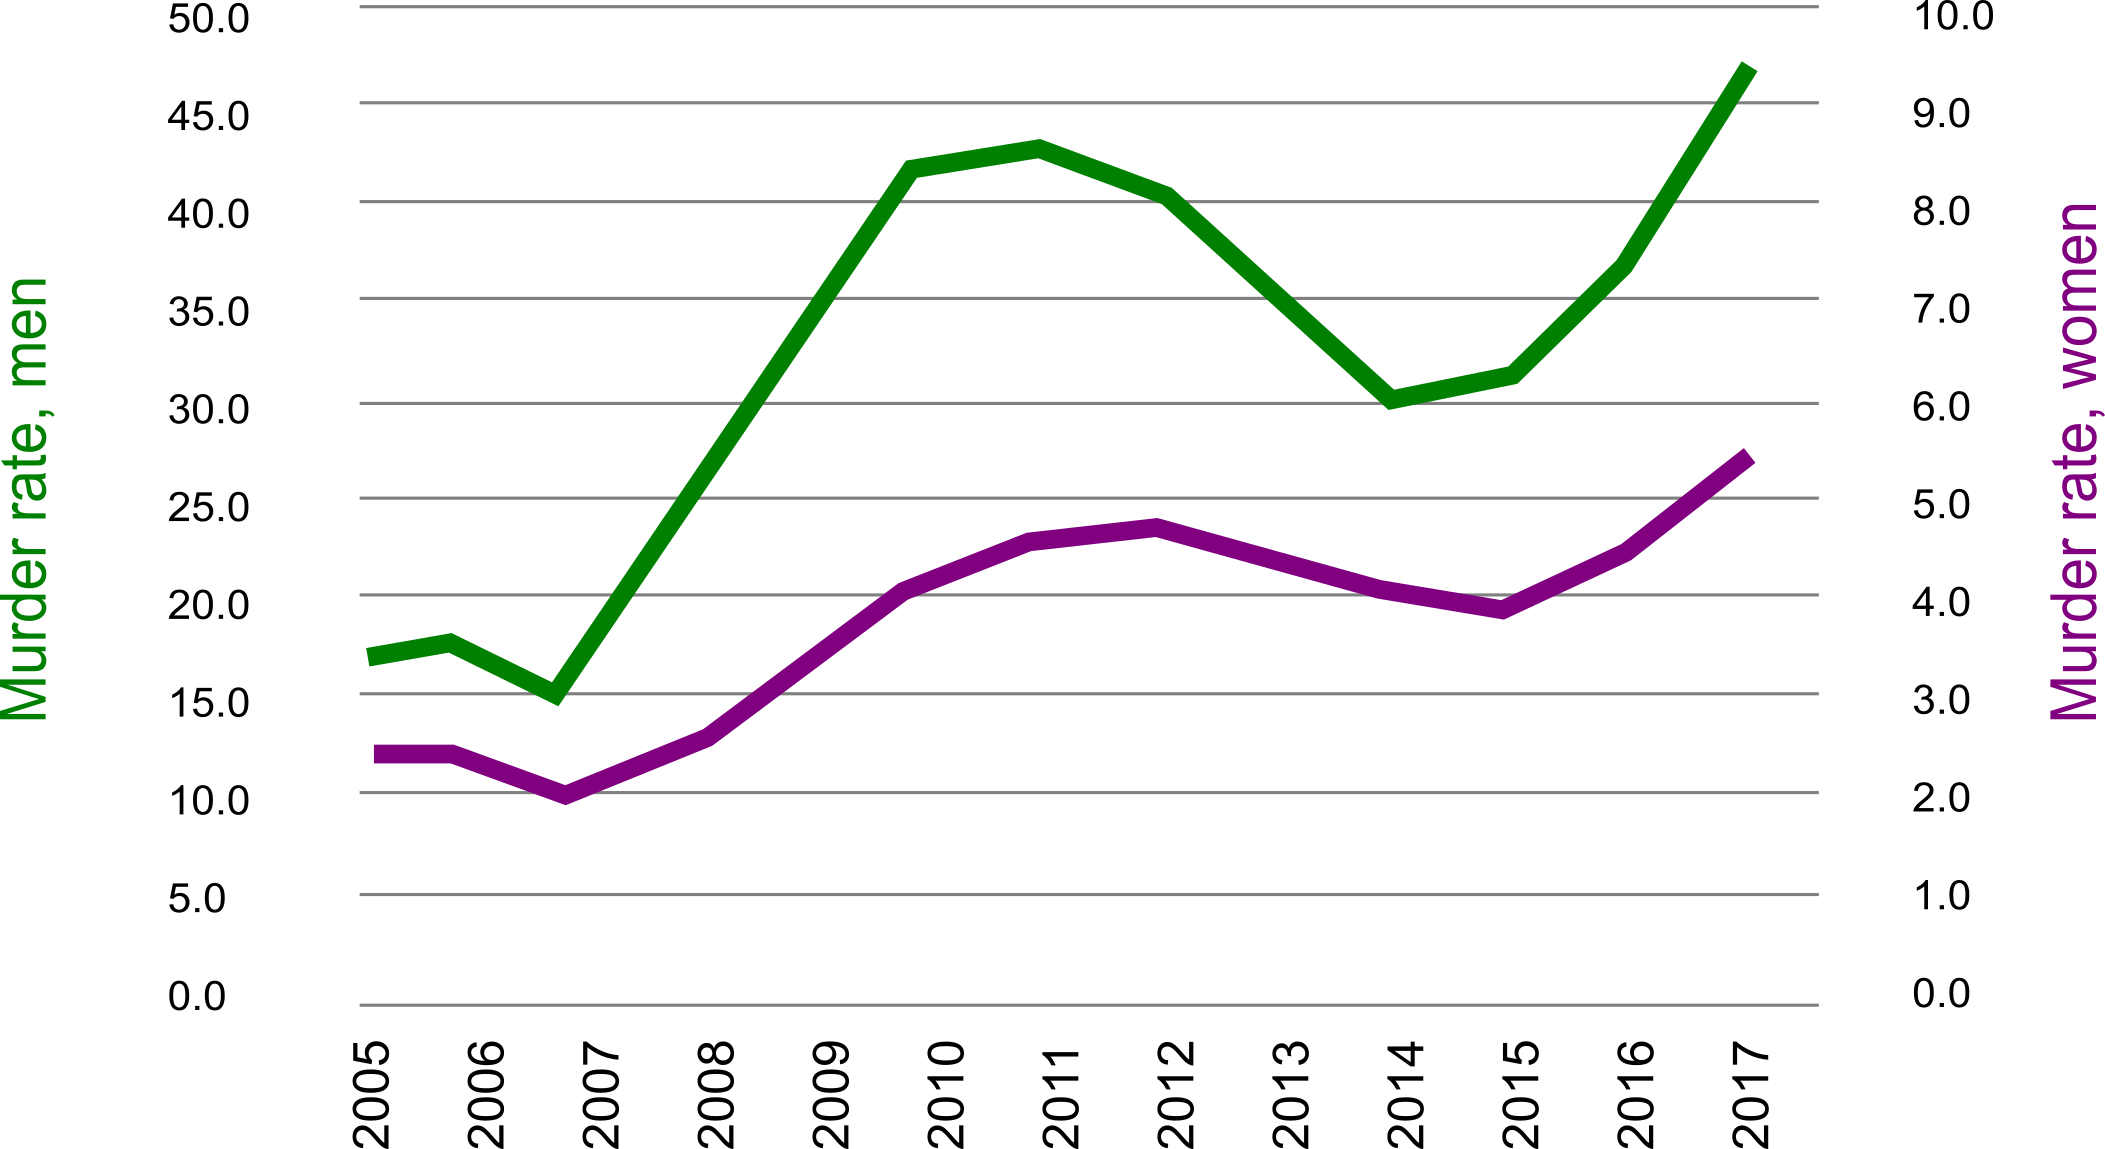
You would expect the number of unidentified bodies to rise and fall with violence. If the data was going to have any value in revealing patterns of violence in Mexico, surely it should get at least this pattern right. But it doesn't and it's tempting to throw up our hands and assume the data is in such bad shape we can't draw any conclusions from it.
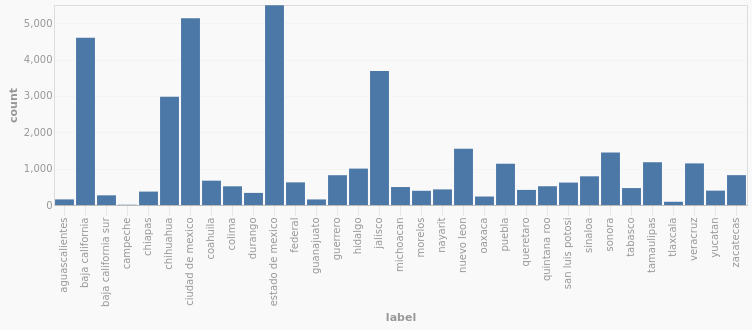
Wait though, Here's unidentified bodies by state:
And here's the number of homicides in the same period by state:
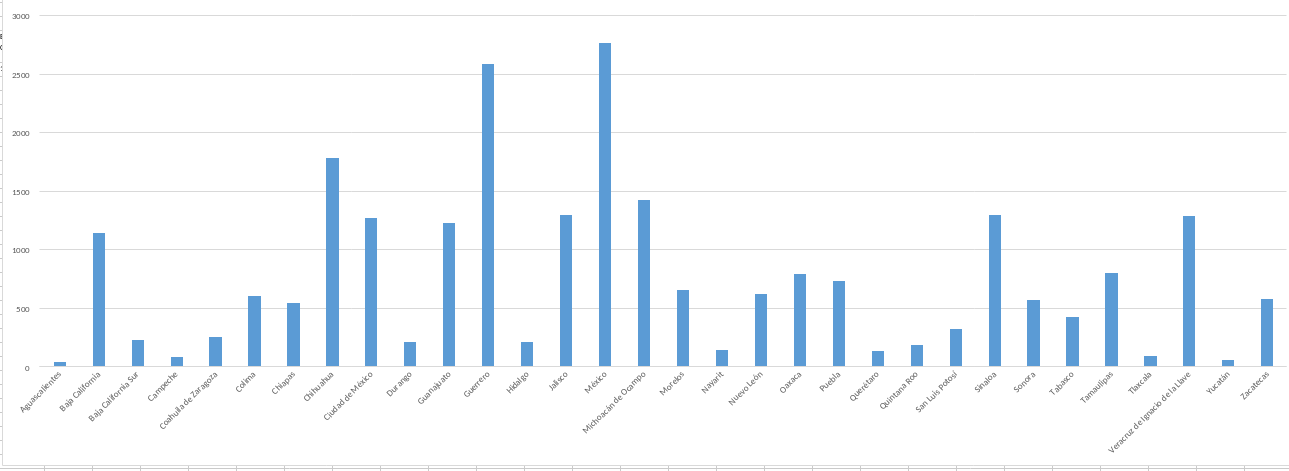
We can see that the states with the largest number of unidentified bodies are the State of Mexico, Baja California (especially Tijuana), Mexico City and Chihuahua, all well known for their narcoviolence. The pattern is not 100% trustworthy. Even though Guanajuato is among the most violent state in recent years, it actually has relatively few cases of unidentified bodies. Still, there is enough correlation to suggest the historical trend for unidentified bodies should follow the trend for homicide.
Machine learning and the cause of death
There's another factor that could throw off the correlation. As mentioned earlier, not all the unidentified bodies died of violence. Searching through the data shows many other causes of death, such as traffic accidents, abortions, and health problems, especially heart attacks. If we could separate the violent from the non-violent deaths, we might see the trend we would expect. Unfortunately, as I mentioned, there is no system to the reporting of cause of death. There are, in fact, 3,658 different causes in the data.

Even among the descriptions of what appear to be similar causes of death, there are many textual differences which make it impossible to draw aggregate conclusions.

In theory it should be possible to go through the entries one by one and label each by hand according to some set list of categories. But this would take hours or days. Instead, we decided to apply a bit of machine learning. We put the database into a Python application called SpaCy, that uses a type of machine learning called Natural Language Processing. This includes the ability to identify parts of speech and finding textual similarity between different documents. It is extremely simple to operate, at least at an introductory level, even for non-machine learning experts. We selected the cause of death entry for 280 of the records (from the total of 38,891) and labelled them by hand as one of "violence", "health", "accident", "abortion" and "unknown."
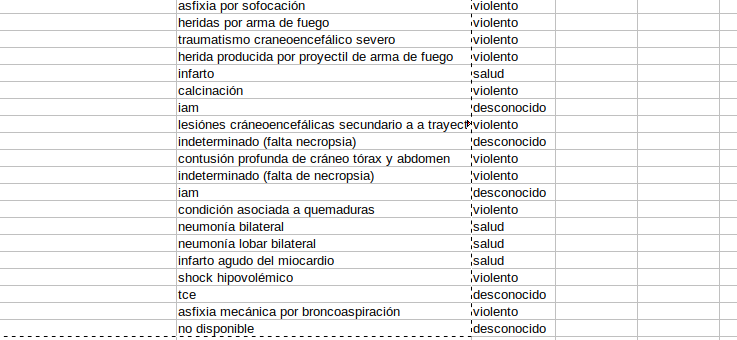
We fed that list, with the labels, into SpaCy, then allowed it extrapolate from that list to the full set of records. At the end, all the records were categorized with the labels. Thus we were able to select only the records of violent death (at least according to SpaCy's judgement).
Now, plotting only violent cause of death by time (in other words, excluding all unidentified bodies that died of other causes, such as accidents or health problem), we see the same dip we saw in the homicide rate.
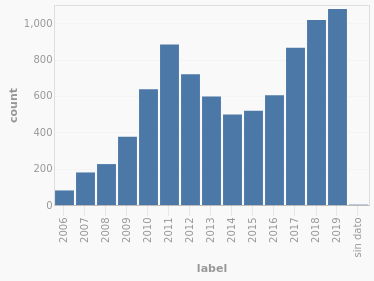
Which, since this is exactly what you would expect, is not really a groundbreaking revelation. But it floored me when that graph popped out because it showed just how powerful machine learning can be. I need to emphasize that the because of the way this kind of machine learning works, we did not give SpaCy a set of keywords, only showed it a few samples of each category, then allowed it to draw its own conclusions. Our methodology was not particularly rigorous, and there were no doubt errors in the categorization, but the matching dips in the two graphs are hard to ignore.
With more effort, it could be used to further categorize types of violent death or other patterns that might be interesting to a researcher. Are certain weapons more common in some states? Can executions be distinguished from improvised assaults? How frequent are cases of dismemberment that we read so much about in the media?